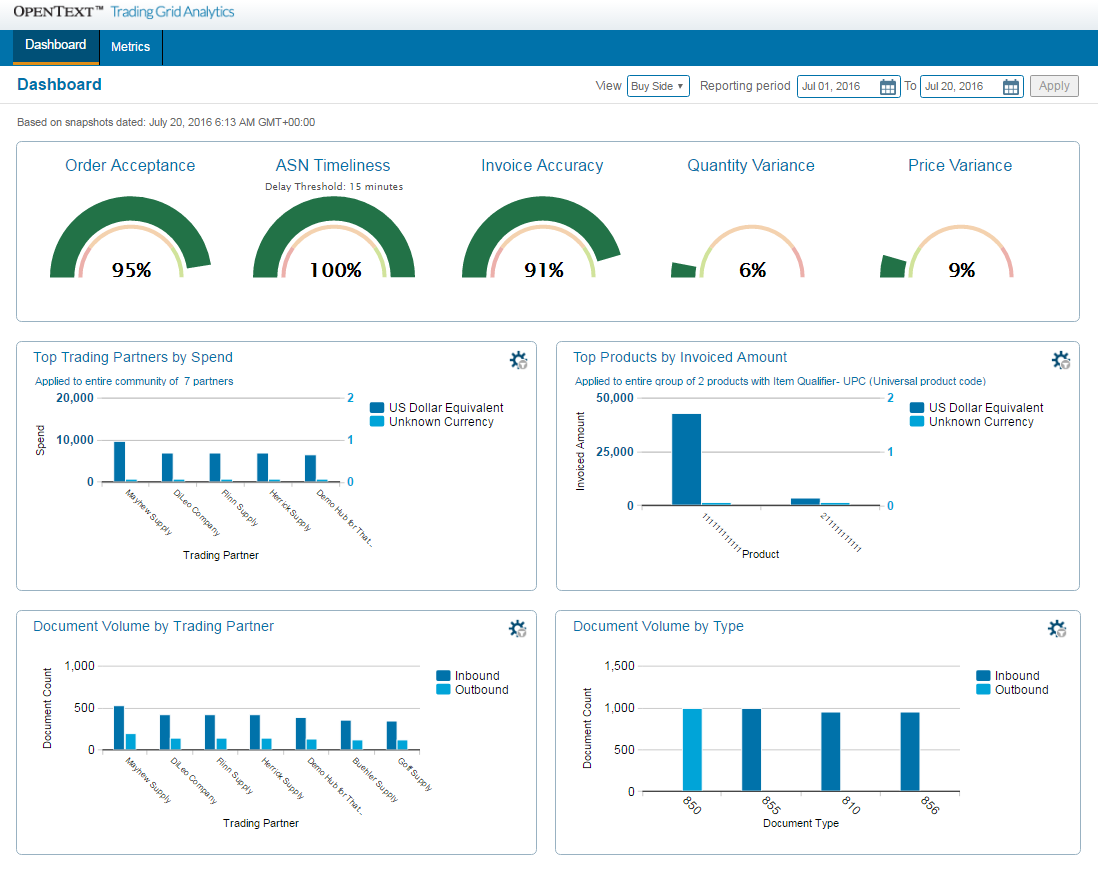
The Analytics Dashboard displays the Key Performance Indicators (KPIs) with dial graphs and bar graphs. See “Analytics Dashboard” on page 176. The system data is updated every 24 hours.
The information can be filtered in several ways, including by date range for the reporting period, currency, and more. See “Filter Performance Metrics” on page 189.
To view the Analytics Dashboard
|
1
|
From the Operations Center page, click Trading Grid Analytics.
|
The Analytics Dashboard opens.
To change the Analytics Dashboard view
You can toggle the view to either the Buy Side or Sell Side.
|
2
|
Click the View drop-down menu.
|
|
3
|
Select Buy Side or Sell Side.
|
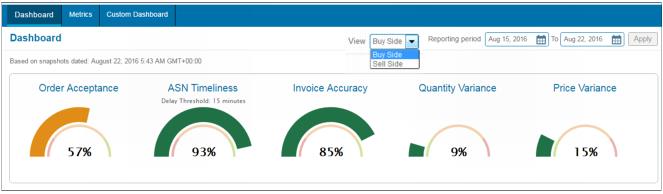
The dashboard updates to the buy side or sell side view.
To change the Reporting Period

|
2
|
Click Apply.
|